![logo-green.png]](https://www.help.archer.re/hs-fs/hubfs/logo-green.png?height=40&name=logo-green.png)
Archer doesn't make you choose between fast and detailed. It lets you choose when you're detailed.
Granularity is a stage, not a setting
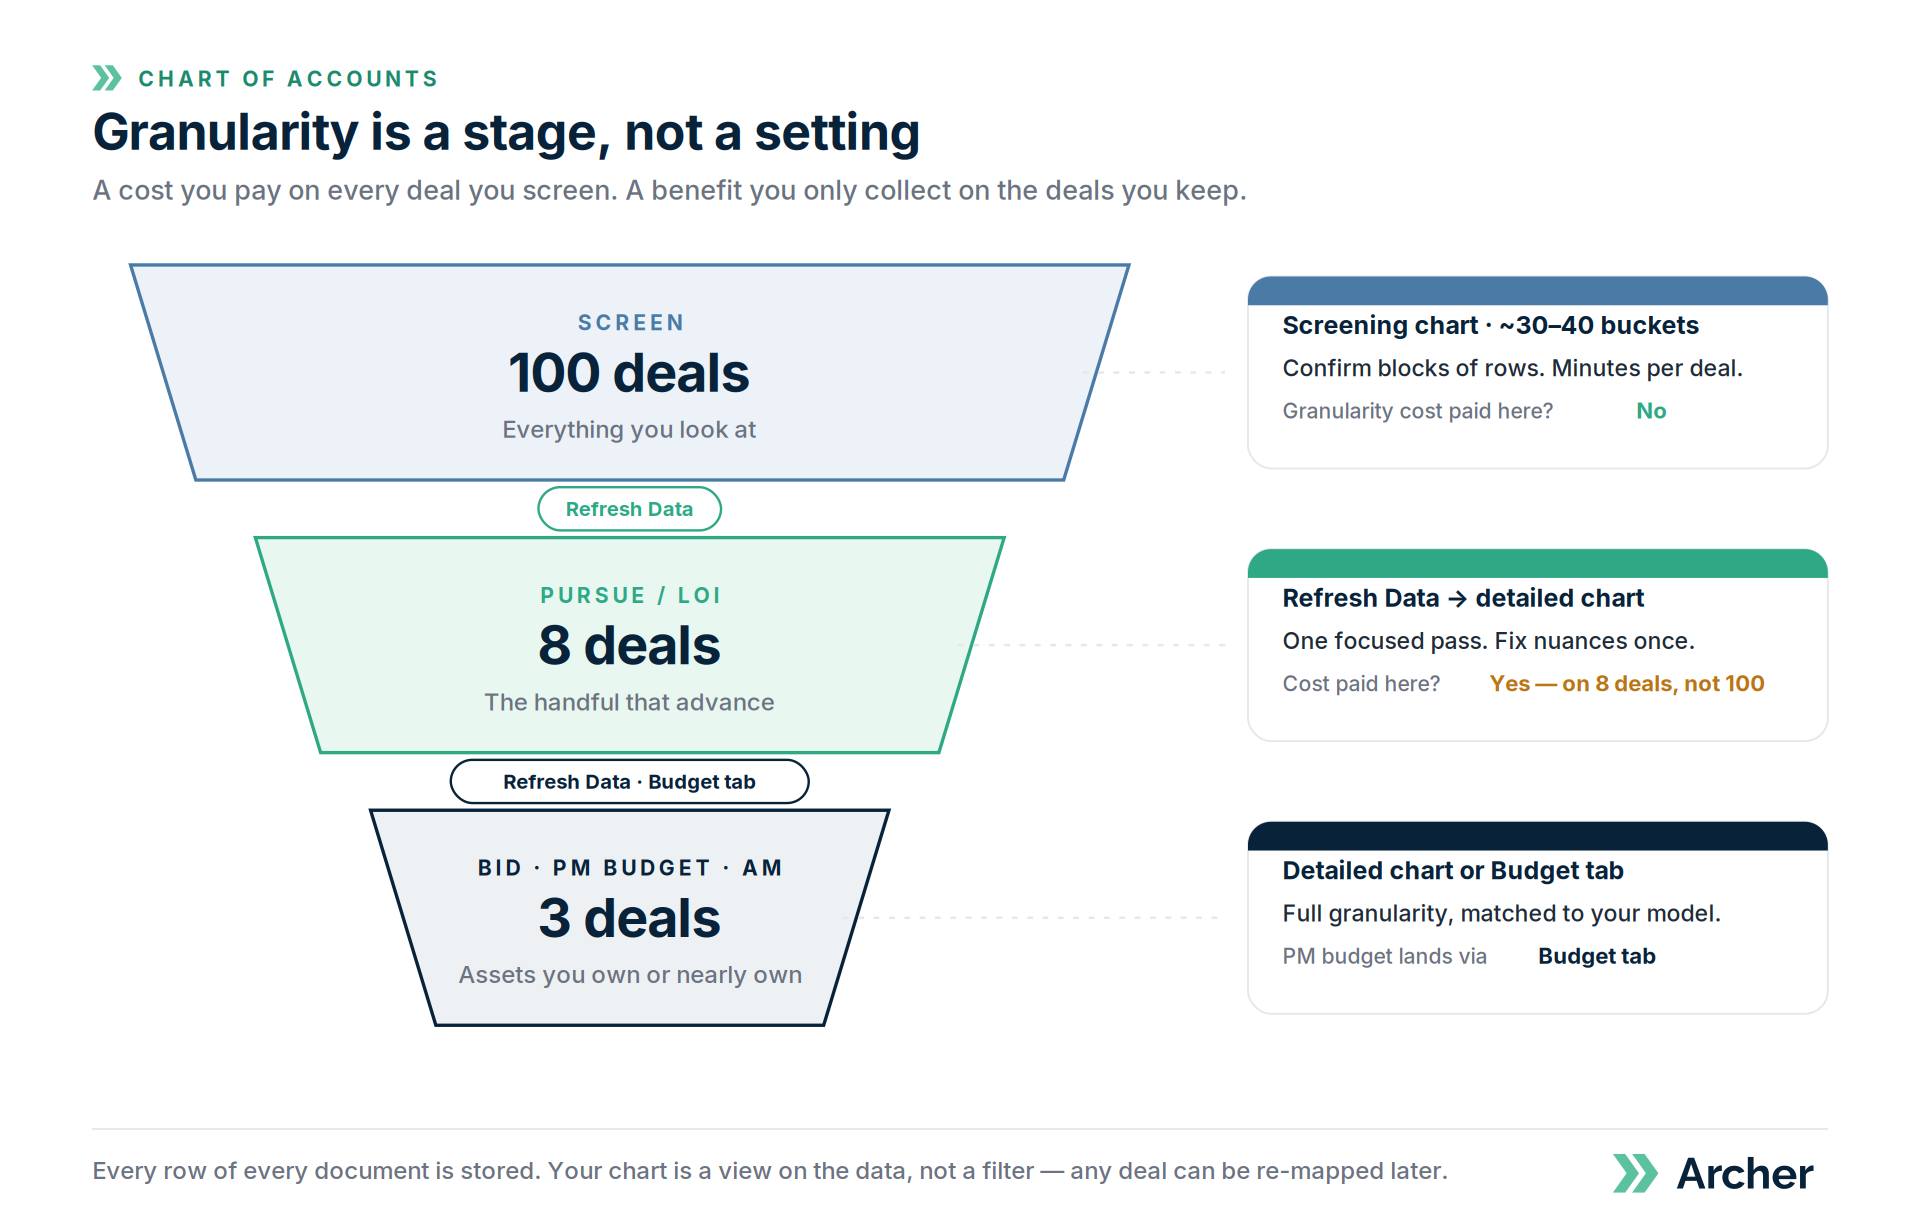
Here's the math most teams don't run at setup. Granularity is a cost you pay on every deal you screen, but a benefit you only collect on the deals you keep. If you pass on 90–95% of what you underwrite, a granular default means paying the tax a hundred times to collect the benefit five times.
So the workflow that works — the one we see succeed over and over — matches the chart to the stage:
| Stage | Volume | Chart in use | What review looks like |
|---|---|---|---|
| Screen / quick-look | Everything you look at | Screening chart (~30–40 buckets) | Confirm blocks of rows. Minutes. |
| Pursue / LOI | The handful that advance | Refresh against your detailed chart | One focused pass. Fix nuances once, on a deal worth the time. |
| Bid / PM budget / asset management | Owned or nearly-owned assets | Detailed chart, or PM budget via the Budget tab | Full granularity, matched to your model. |
Why review time is the real cost
At ~35 buckets, you glance at a block of 25 R&M rows and confirm one answer. That's confirmation — fast, low-attention, batchable.
At ~200 buckets, you make 25 separate decisions, each one holding twenty near-identical options in your head. That's judgment — slow, high-attention, and it doesn't batch.
Same document. Same parse. Same rows. The work changed category. And you pay it on every deal you screen, including the ninety you're going to pass on.
Why this isn't a model limitation
A row that reads "Supplies — $4,120" could be office, janitorial, or maintenance supplies. Nothing in those eight characters resolves it — not for our model, not for your best analyst. At the Repairs & Maintenance subtotal, all three answers are the same answer, so the ambiguity costs nothing. Split it into three buckets and it becomes a manual decision on this statement and every statement after it, because next month's row still just says "Supplies."
We're not hitting the limit of the model. We're hitting the limit of the document. Accuracy runs ~98% on trained categories at subtotal level, and 90%+ at Level 1 detail after five to ten deals of team-specific learning. More on this in Why some line items are hard to map.
You don't give anything up
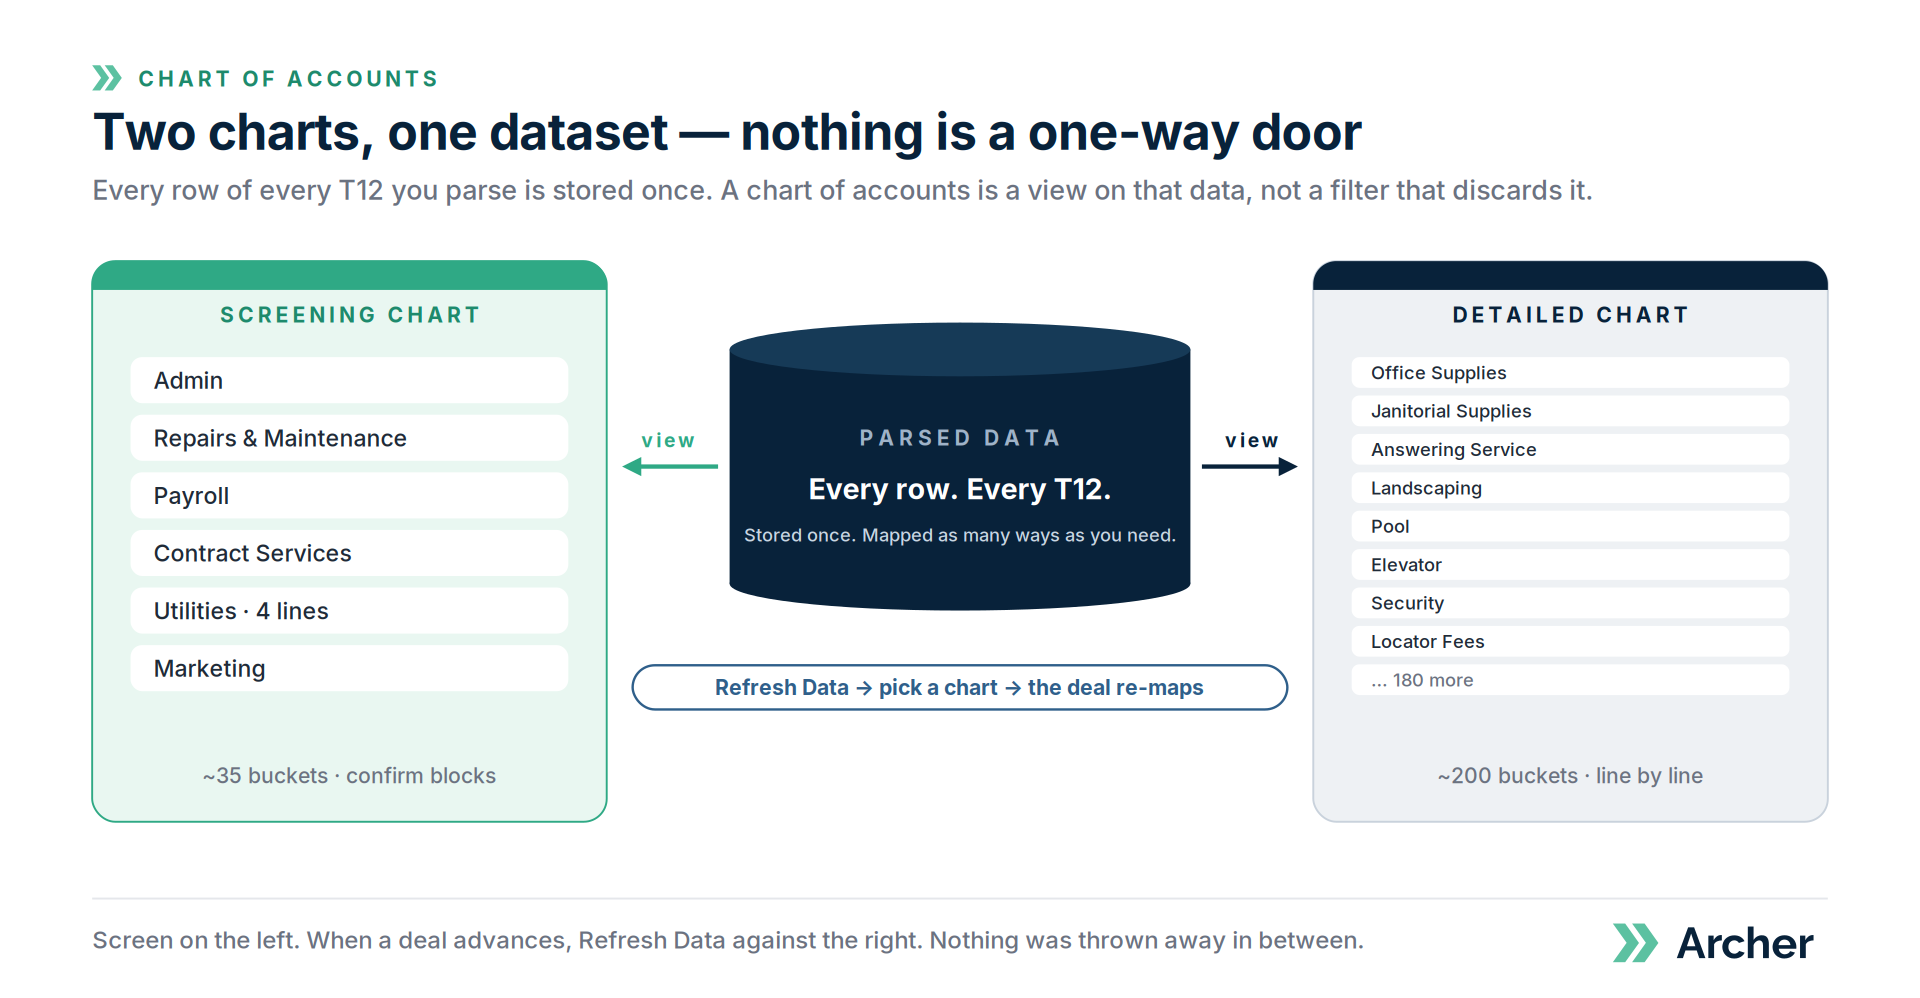
Every row of every T12 you parse is stored. Your chart of accounts is a view on that data, not a filter that discards it. Screening at a high level doesn't throw anything away — it reports at the level where the information is actually reliable.
When a deal advances, re-map it against your detailed chart:
- In Excel, click Refresh Data on the Archer ribbon.
- Select your detailed chart from the dropdown.
- The T12 re-maps to the new structure. Review the yellow column once, on a deal that's worth it.
To set up a second chart: click your name → Settings → Chart of Accounts. You can maintain multiple charts and pick which one to use on each underwrite. Note that a chart and a model are a matched pair — if you add a chart that your current model isn't built for, we'll help pair it (see Four ways to structure your chart of accounts).
The bottom line
Screen at the level your pass/pursue decisions actually need. Go granular when a deal earns it. Nothing is a one-way door.
Related
- Four ways to structure your chart of accounts → https://www.help.archer.re/four-ways-to-structure-your-chart-of-accounts
- Which line items should I break out? → https://www.help.archer.re/coa-turn-it-on-test
- Upload a Year 1 budget with the Budget tab → https://www.help.archer.re/budget-tab-year-1-budget
- How Archer's machine learning improves your mapping → https://www.help.archer.re/machine-learning-mapping